
January 16 2020 – It is good to know that so far, the administration of Donald Trump has not been able to muzzle data from NASA and NOAA regarding temperature observations around the planet. The two agencies capture data from thousands of ocean buoys, and from tens of thousands monitoring stations to provide an accurate picture of our planet’s temperature.
Even when a monitoring station is moved, the two agencies have the ability to analyze discrepancies and remove analytical bias. So climate change skeptics have no leg to stand on that could suggest data is being skewed to support a climate change agenda. The data collection is transparent and available to the public. And although NASA and NOAA studies are assembled differently, the results and conclusions from both remain the same.
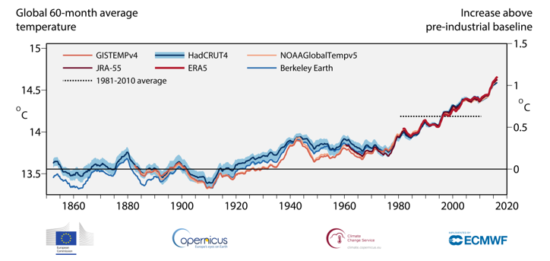
Then there is the data collection from the Copernicus Climate Change Service (C3S), Europe’s equivalent to NASA and NOAA which further backs up a common conclusion.
And what is it?
The last ten years globally are the warmest in recorded history. That doesn’t mean some areas of the planet have been cooler than normal.
We know that climate change skeptics cherry-pick data to reinforce their positions and I am sure some will cite temperatures recorded in the Central Plains and Prairies of Canada, two areas that experienced cooler conditions than normal in 2019.
But they can’t ignore the overwhelming trend as seen in the collected data, that our planet is seeing temperature increases exceeding the norm. The trends are there for all of us to see. In 2019:
- Australia and Oceania had the warmest year on record
- Europe had its second warmest year on record
- South America had its second warmest year on record
- Asia and Africa both experienced the third-warmest year on record
- North America, on the other hand, experienced only the 14th warmest year on record with the United States, the 34th warmest year excluding Alaska, North Carolina, and Georgia which recorded their warmest years ever
And then there are the oceans which recorded their warmest year on record for total ocean heat content and the largest single-year increase in the last ten years.
For those global warming skeptics who predict that a new Ice Age is in our near future, the NOAA, NASA and Copernicus data has to be a colossal disappointment. Across 22 nations and territories, there were no tied or new all-time cold records set in 2019. In contrast, 638 places exceeded all-time highs, whereasonly 11 stations set all-time records for cold. That’s a hot-to-cold ratio of 638:11.
Some other 2019 statistics to note:
- The hottest temperature in the Northern Hemisphere in 2019 – 53.1 Celsius (127.6 Fahrenheit) occurred in Shahdad, Iran on July 2nd
- The hottest temperature in the Southern Hemisphere in 2019 – 49.9 Celsius (121.8 Fahrenheit) occurred in Nullarbor, Australia on December 19th
As for coldest temperatures in 2019:
- in the Northern Hemisphere, -60.5 Celsius ( -76.9 Fahrenheit) at GEOsummit, Greenland on January 14th
- in the Southern Hemisphere, -82.7 Celsius ( -116.9 Fahrenheit) at Dome A, Antarctica, on June 15th
All-time record-high temperatures and the highest average yearly temperatures were recorded across North Africa and the Middle East. It should be noted that existing and past climate models have all overwhelmingly predicted global warming would have the greatest impact in these areas of the planet.
I think what surprised climatologists in 2019 were three things:
- the extent and escalation of ocean heating at rates 44 times greater than all the energy used by humans in 2019
- the unprecedented extent of Southeastern Australia wildfires exacerbated by record heat, low humidity, and more than three years of drought
- the acceleration in the rate of ice melt on Greenland, in East Antarctica, and in Himalayan alpine glaciers (described as Earth’s third pole) in Central Asia
So that is the world we left in 2019. What will we be saying about global temperatures in the next ten years? Is 2019 foreshadowing more of the same?
Related Posts
 Will Americans Stage a “Managed Retreat” from Their Coastlines?
 Implementing Technology in Business to Achieve a Sustainable Environment
 Conversations About AI: A University-Level Guideline for Its Ethical Use
 Social Media and Small Screens are Negatively Impacting Youth
 If You Are Using Semaglutide Drugs to Lose Weight Are You Hooked on Them for Life?
 A Once-a-Year Low-Cost Shot to Treat Cholesterol is Being Developed
 Can Planets Exist Without a Star?
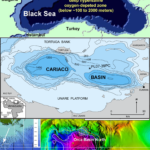 Decarbonization Conversations: Anoxic Marine Basins May Help Mitigate Climate Change


