April 29, 2015 – The world is increasingly urbanized. In the past six decades the population of the planet has shifted with more than half of us living on less than 1% of the global land area – cities. These urban spaces are the economic engines of human civilization and many are increasingly at risk because of declining access to freshwater. That’s because since 1950 urban freshwater use has increased by 500%. You can name some of the cities at risk just from recent headlines: Los Angeles, Sacramento, San Jose, San Diego, San Francisco, Phoenix, Tucson, and Las Vegas in the United States, Sao Paulo in Brazil and Chennai in India. These cities rely on surface freshwater supplies from rivers, and reservoirs, both natural and artificial.
In a recent study entitled, Global analysis of urban surface water supply vulnerability, by environmental scientist, Julie Padowski and Steven Gorelick, Director of the Global Freshwater Initiative at Stanford University, the authors analyzed 70 cities with populations greater than 750,000. The cities were distributed over 39 countries.
The parameters used to assess risk assigned a daily ration per urban resident of 4,600 liters of freshwater. They defined this as “virtual water” encompassing all freshwater usage within the urban environment and its immediate surroundings. That included water use for domestic, manufacturing, commercial, and agricultural consumption.
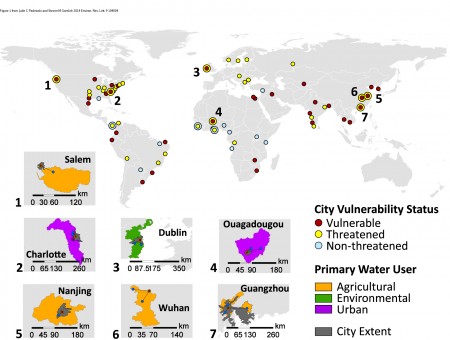
When measured against this “virtual water” ration it was found that 36%, that is 25 cities, were already vulnerable in 2010. They then projected population growth, and freshwater supply and demand to 2040. By that year 44% of the 70 cities, 31 in total, would be vulnerable. The additional six cities were identified as Dublin, Ireland, Charlotte, North Carolina, Salem, Oregon, Ouagadougou, Burkina Faso and Guangzhou, Wuhan and Nanjing, China. With the exception of Ouagadougou which resides in a semi-arid climate zone, you don’t think of these other cities as suffering from potential freshwater scarcity. But the problem of adequate availability is driven by multiple factors of which climate is just one. And for this study, Padowski and Gorelick didn’t even factor in the potential impact of climate change.
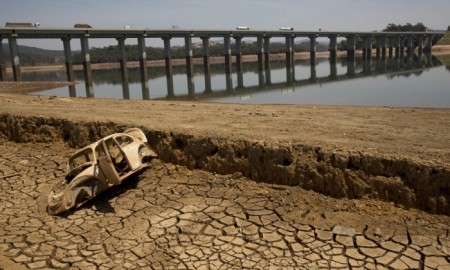
A good example of just what can happen to urban areas when freshwater demand exceeds supply is Sao Paulo in Brazil. The worst drought in 80 years has systematically drained the reservoirs and rivers that feed this city of 20 million plus. The key reservoir that supplies much of the city’s freshwater in January of this year reached record low capacity (see picture below), just 6% of its normal volume. What brings even more urgency to the crisis, the readings were done halfway through Sao Paulo’s rainy season.
Is this the fate of Las Vegas and Los Angeles as Lake Mead and the Colorado River basin get tapped beyond their capacity to sustain the urban populations of these American cities? California is attempting to ration freshwater as one means of extending the resource. But even without the prolonged drought that has impacted the American Southwest, these large urban centres, reliant on surface freshwater resources, would be in trouble.
Look at Los Angeles. Early in the 20th century it had already commandeered much of the surface water capacity of its surroundings. And today it draws water from pipelines and rivers outside of California, across the Sierra Nevada Mountains.
Guadalajara, Mexico, is another city that draws freshwater from well outside its immediate vicinity competing with local agriculture for the declining resource.
In India Hyderabad, Pune and Chennai have almost sucked dry the Krishna basin.
There are cities that seem to be doing all the right things. One is New York City which has protected its watershed and enacted measures to ensure it has more than enough freshwater for now and well into the future.
The world map visible below shows the cities that formed part of the study. Note none of the California cities described in this posting were included. Nor were Las Vegas, Phoenix or Tucson. I am not sure why even though the authors do cite the history of water use in Los Angeles within their commentary.
To help you better understand the map, colours and circles identify which are currently vulnerable or at risk by 2040. Status changes are marked by a coloured outer ring for 2010 and inner circle representing at risk by 2040. Cities marked in red are those currently facing urban water scarcity. Cities marked in yellow are those with growing freshwater and environmental issues. Cities with no water supply issues are marked by light blue circles. The seven numbered locations represent the cities and surrounding regions that the study projects to be freshwater vulnerable by 2040. The urban centres are depicted in gray on the inset maps below the world map. Freshwater sources are marked by blue circles.
Is your city on this map?


