March 18, 2020 – Automobile traffic here in Toronto no longer has a rush hour. There are fewer contrails in the sky because airlines are flying less or shutting down. People aren’t commuting to work, but rather telecommuting from home. Manufacturers are running reduced shifts or are temporarily closing. The schools are out right now for three weeks or maybe even longer. All of these developments are a consequence of my city and country going into lockdown to limit social interaction and try stopping COVID-19 from spreading.
This change in human activity is not just to be found in my country. It is becoming common almost everywhere where the virus has struck. And based on satellite images, this changed behaviour everywhere is significantly reducing greenhouse gas (GHG) emissions in our global atmosphere. This came to me as I was reading headlines that claimed most major airlines would be bankrupt by the end of May because of COVID-19, and the automobile manufacturing sector throughout the world would be making dramatic production reductions for the foreseeable future.
In terms of human-generated air pollution, transportation and manufacturing rival electricity and heat production as among the largest contributors of atmospheric GHGs. Take these two out of circulation, so to speak, and you can reduce human GHG emissions by as much as 35%. That’s an interesting number because it is even greater than the GHG emission reduction target Canada is hoping to achieve by 2030, a 30% decline.
It wouldn’t be fair not to point out that the reduction in the above two sectors will be partially offset by those people who aren’t commuting and who are staying at home. They will need more electricity and heat. The difference, however, is if someone is already at home, the additional heat and energy being added would only play a small part in increasing GHG emissions. Even empty homes use electricity and heat. Today, our built infrastructure contributes far fewer GHG emissions than transportation and manufacturing. In the end, there should be an overall decline in emissions.
Does the evidence bear this out?
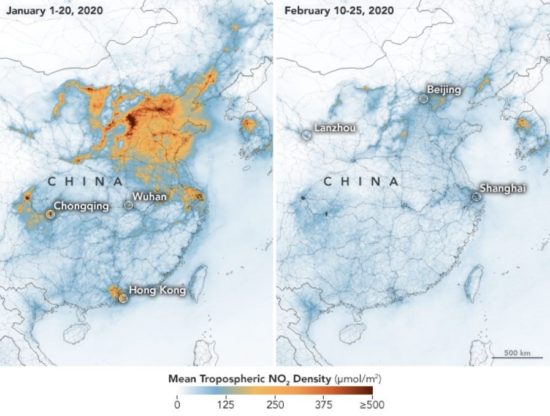
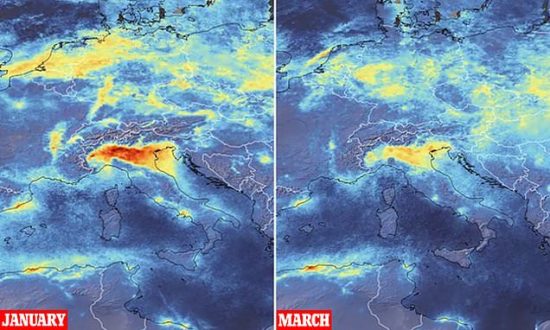
Satellite imagery over China and Europe supports this hypothesis as you can see in the pictures that follow.
In China, the epicenter of the COVID-19 pandemic, the lockdown national response has produced a decline in emissions from coal-fired power plants coincident with reduced manufacturing and transportation. NASA satellite images taken in January and February 2020 show how significant the short-term decarbonizing has been over China’s major urban and industrial centers. In the following map of the country, tropospheric concentrations of nitrous dioxide (NO2) largely produced from thermal power plants and motor vehicles is the measuring stick.

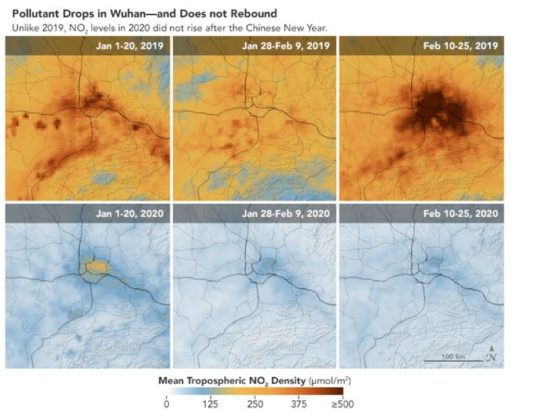
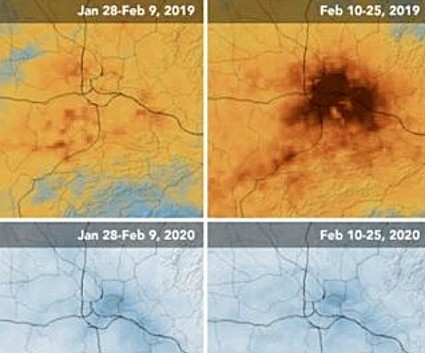
Drilling down on Wuhan where COVID-19 first made its appearance you can see the comparisons. In the six images below the changes to GHG emissions between January and February 2019 and the same period in 2020 are starkly revealing.

The net emissions decrease as seen in the images above represents a 30% decline from 2019. And better yet, there has been little in the way of a rebound to 2019 levels so far.
Italy is our second example. It is another epicenter for the virus. Here too we see a similar decline in NO2 emissions recorded by satellite. From January to March the concentration of GHGs in the troposphere have notably declined.

This pandemic is brutal. It is disrupting the entire planet. But one thing is certain, the virus is showing us that changing our behaviour can curb GHG emissions. When the pandemic finally subsides we may learn something, that we at least through modifying activities can immediately impact the atmosphere significantly. For policymakers seeking climate change mitigation strategies, we may have learned a valuable lesson.


