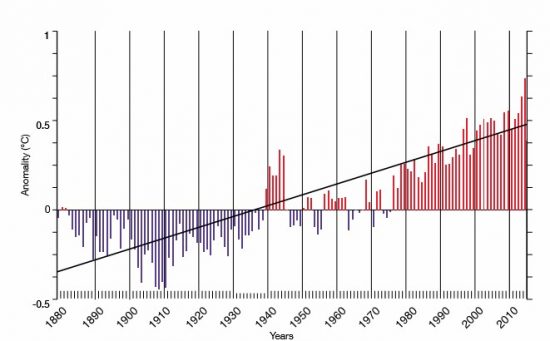
September 13, 2016 – NASA reported yesterday that August was the 11th straight month setting global heat records. August global average surface temperatures were 1 Celsius (1.76 Fahrenheit) above average. This duplicated the July statistics. NASA spokespersons stated that 2016 will be the third year in a row of record setting temperatures.
Seeing the temperature creep is what is so mind numbing about the climate change narrative. A degree here, a degree there. It’s never 5 degrees or 10, at least in the mid-latitudes of Southern Canada and the United States. Nearer the poles however this 1 Celsius rise translates to mean average temperatures 4 to 5 Celsius higher in Arctic communities. For the people who live in these northern climes the reality of global warming can be seen daily.
More disconcerting than land temperature increases is the rise in global ocean surface temperatures which continue to increase. In a new report issued by the International Union for Conservation of Nature, a comprehensive review of ocean data concludes that “the scale of ocean warming is truly staggering with the numbers so large that it is difficult for most people to comprehend.” The graphic representation of that rise is reproduced from the report and appears below.

Described as the “greatest hidden challenge of our generation,” the report begins with the following statement:
“By absorbing a disproportionate amount of heat from global warming and by taking up the rapidly increasing emissions of carbon dioxide, the ocean has shielded the world from even more rapid changes in climate. However, the extent to which it can continue to do so in the near and distant future is far from clear.”
How much atmospheric carbon dioxide (CO2) gets absorbed by the ocean? Solubility volume is a function of ocean temperature. Colder water can absorb more. Warmer water can absorb less. About half of the CO2 we humans produce annually remains in the atmosphere. Approximately a quarter gets taken up by the ocean and the remaining quarter by land-based carbon sinks.
Here are the predictions based on observed trends as presented in the report:
- an increase in mean global ocean temperatures of 1 to 4 Celsius (1.8 to 7.2 Fahrenheit) degrees by 2100.
- greatest warming to occur in the Southern Hemisphere with implications for Antarctic ice shelves.
- significant ice loss in the Arctic Ocean, not as much in the Southern Ocean where surface ice has remained stable or grown in coverage despite warming temperatures.
- intensification of El Nino events with a projected shift in its location from off the South American coast towards the central Pacific.
- increases in deep ocean water temperatures which threatens frozen methane hydrates at depths of 200 to 2,000 meters (approximately 650 to 6,500 feet). Their release could add 2.5 Gigatons of methane to the atmosphere accelerating warming.
- unknown impacts on ocean biodiversity with an expectation that warming will be significantly disruptive to marine life.
To mitigate against these trends the authors of the report make these recommendations:
- public recognition of the scientific evidence collected to date.
- investment in rapid expansion of modeling and observation science to continue to monitor current health of the ocean.
- risk assessments needed to understand the human and biological impact of current and projected warming.
- development of comprehensive global policy supported through international treaty with funding and license to act.
- rapid and substantial cuts to greenhouse gas emissions “the overarching solution.”
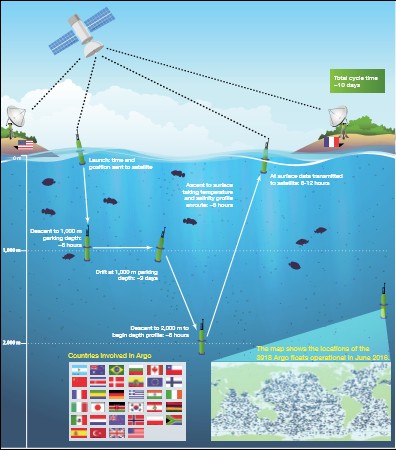
How do we know so much more today about ocean conditions? As reported here in previous postings, the Argo project, initiated in 2000, has deployed more than 3,000 floating platforms around the globe (see graphic below) and compiled more than 1.5 million profiles revolutionizing our understanding of the surface of the world ocean. At the same time Argo has added subsurface observation technology to study conditions in the deep ocean which measure temperature, salinity and other chemical factors including carbon absorption. These Argo robotic devices park at depths down to 2,000 meters and then rise to the surface to report findings regularly.
Take for example the prediction that we will see greater warming in the Southern Hemisphere. How do we know this? Because Argo evidence shows that the Southern Ocean is taking up increasing quantities of atmospheric CO2. Why? Because the Antarctic ice shelves melt is keeping the temperatures of the ocean surface there cooler than elsewhere around the planet. That means CO2 absorption capacity is greater in the Southern Ocean.
Argo is just one in a number of programs that make up the Global Ocean Observing System (GOOS). Data across all observational sensors is consistent. The pattern of warming is accelerating. What can that mean? A warmer ocean means more active air currents above the surface and that translates to more destructive weather events. So although we appear to be in a season with low incidents of hurricanes in the Atlantic, and typhoons in the Pacific, the warming points to a likelihood of increased frequency and intensity of ocean-generated storms.


