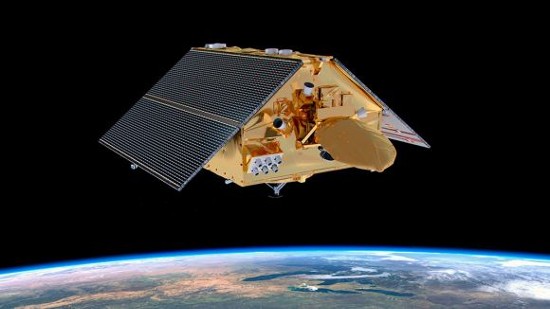
Do 9.1 centimetres sound like something to be concerned about when discussing sea level rise? In Imperial units, that’s 3.58 inches. The data from NASA satellites show that the seas are rising. It is not caused by natural variability from periodic cycles such as El Niño and La Niña events. It is caused by anthropogenic global warming. And the rise is accelerating with sea levels up 0.27 centimetres (0.1 inches) from 2021 to 2022. Based on current trends, NASA projects the rise to be 0.66 centimetres (0.26 inches) annually by 2050.
Anthropogenic (human-caused) global warming isn’t evenly distributing sea level increases around the planet. Different physical geography makes some areas more susceptible to coastal flooding and high tides. Rising seas speed up coastal erosion which is becoming increasingly evident around the world.
Rising seas also are impacting the Earth’s polar lands. In the Antarctic and Greenland, the combination of the warming atmosphere and warming sea surface temperatures are causing increased melting of land-based ice. This is having a destabilizing impact with NASA fingering Greenland ice melt as the major culprit in accelerating sea level rise.
Sea Level Rise is Best Tracked from Space
Why rely on a space agency to tell us about the state of our ocean? Isn’t there enough data from harbours and tide charts from around the world to tell us the current state of sea level rise?
Remote sensing satellites that monitor the ocean surface are a mere three decades old, whereas terrestrial-based observations have been providing almost a century of historical measurement. The latter is important for doing trend analysis but for tracking what is happening across the entire ocean surface, the data is largely non-existent.
That’s why the consensus is unanimous to measure sea level changes best can only be done from space. Since 1993, NASA and the European Space Agency (ESA) have put remote-sensing Earth-orbiting satellites to continuously monitor ocean surface heights. The satellites use sensitive radar altimeters to take precise measurements of the most minute changes over the entire marine surface. No terrestrial-based measuring system can capture what the satellites do.
Mid-Century or Sooner Consequences
In past posts of which I have highlighted one, (there are more than 400 in total based on a “sea level rise” search result, I have written about the growing threat to coastal communities in the United States and around the planet. So just how vulnerable are we to a 0.27-centimetre annual rise or an accelerated increase of 0.66 centimetres?
In a publication by the Union of Concerned Scientists, it lists the material peril of rising sea levels to Americans:
- More than 300,000 of today’s coastal homes in the U.S., with a collective market value of about $117.5 billion will be at risk of chronic inundation by 2045, a timeframe falling within the lifespan of 30-year mortgages issued in 2018.
- Approximately 14,000 coastal commercial properties, assessed in 2018 at a value of roughly $18.5 billion will also be at risk by 2045.
- Homes and commercial properties valued at $1 trillion in 2018, will by the end of the century all be at risk. That’s as many homes as can be found today in the cities of Los Angeles and Houston combined.
- The states with the most homes at risk by 2100 include Florida, at a million, or more than 10% of current residential properties, followed by New Jersey, at 250,000 homes, and then New York with 143,000 homes.
A Call to Action
Measuring carbon dioxide and other greenhouse gas levels has always been the common measure of anthropogenic climate change. But states Josh Willis who is an oceanographer with NASA JPL in California, “Tracking the greenhouse gasses that we add to the atmosphere tells us how hard we’re pushing the climate, but sea levels show us how much it’s responding.”
So 9.1 centimetres does matter and the best way to slow the rate of increase is through collective global action to drive down carbon emissions as rapidly as possible. Tell that to the banks that continue to fund fossil fuel projects, and to the governments that grant leases to oil companies to drill exploratory wells or finance the building of pipelines.


