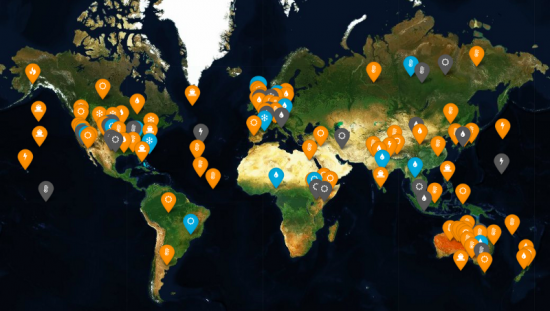
March 3, 2018 – The above map of the world attempts to illustrate the effects human activity is having on global climate. The map is the creation of Carbon Brief, a United Kingdom-based organization that covers climate science, and climate and energy policy. In 2017 its web presence was recognized by the Online Media Awards as the Best Specialist Site for Journalism.
All indicators highlighted on the map represent extreme weather occurrences. The ones in orange, the overwhelming majority, have been attributed to human influence. The ones in blue have no human influence attached to their occurrence. The grey ones are inconclusive.
The countries most affected by human-influenced extreme weather appear to be the United States and Australia. This attribution is not necessarily a reflection of a concentration of extreme events, but rather better scientific reporting in the affected countries. For example, Australian scientists are big into heatwave studies. Almost a quarter, 24%, of heatwave events are represented in the concentration of orange seen on the map. In only one case have scientists concluded that there was no human-causal link, and that was in the city of Melbourne, although as part of that study, the city of Adelaide further west indicated extreme weather influence from human activity.
The data points here represent 144 weather events compiled from 138 separate scientific papers. Of these, 68% have been made more severe because of human influences on climate. Nearly half, 46% of these events are related to heat. Heavy rainfall and floods represent 14%. Droughts make up 21%.
It should be understood that the human contribution to a weather event does not mean that humans caused the recorded extreme. And if an extreme event occurred in an area it doesn’t mean that there is a greater likelihood of a repeat each year.
Also note that there are no site markings in the extreme north above the Arctic Circle where sea ice melt is associated with changing conditions there, along with speculation related to occurrences of polar vortices in areas where they are not commonly seen. For example, the current “Beast from the East” plaguing Europe, a winter storm so severe in this last week that it is bringing the business of the continent to a halt. Could this be human-influenced, a consequence of a warming world ocean escalating Arctic sea ice to retreat, and causing Jet Stream oscillations that draw down colder air to places where it infrequently occurs?
How bizarre is this latest European weather event? In February the extreme north on nine separate days experienced above zero Celsius temperatures, 30 degrees warmer than the norm in the Arctic winter. This warm air intrusion during a period of winter darkness also led to record warmth in Siberia with temperatures as much as 35 Celsius above average. The northern tip of Greenland remained above freezing for 61 hours, three times longer than in any previous year.
The displacement of cold air by warmer air in the Arctic ended up pushing the former into Europe and parts of North America. Where the latter has experienced these polar vortices in recent years, the phenomenon is new to Europe. And not only does cold air displace the warm air, it also alters wind patterns. In the case of the latest European storms, westerly winds have been reversed to become easterly.
In the United States, weather forecasters blame air from Canada when a polar vortex arrives. In Europe, the blame game looks at two culprits. First, there is the Siberia effect, and second, Scandinavia, where the cold high pressure, normally over the North Pole, now firmly has implanted itself over Norway, Sweden, and Finland.

As Arctic sea ice continues to disappear the Jet Stream will be further weakened allowing cold air to drop into the mid-latitudes in the Northern Hemisphere. For climate skeptics, who point to every low temperature as validating their arguments that global warming is a fiction, polar vortices represent ammunition. The nonsense of this only becomes apparent when climatologists describe the correlation of changes to the Jet Stream from rising ocean temperatures globally and particularly in the Arctic. The warming ocean correlates with the increased warming of the air above it from the tropics to the mid-latitudes. This warming extends throughout the entire vertical water column to the ocean depths. Combined with the warming is the increased amount of carbon entering the world ocean absorbed from increases in carbon dioxide in the atmosphere. It’s all interconnected and only the foolish and blind-sighted don’t see the correlation to human activity.


